As combines roll across the nation’s wheat fields, farmers have a lot to think about. High wheat prices, high input prices, drought followed by too much rain and turmoil in international markets, among other factors, have made for an unclear start to 2022.
While clarity on these factors is still months or more away, this article seeks to provide thought-provoking charts and insights. We hope you get some downtime (unrelated to breakdowns) in the combine cab and enjoy browsing the charts, analysis and insights.
A Closer Look at Prices
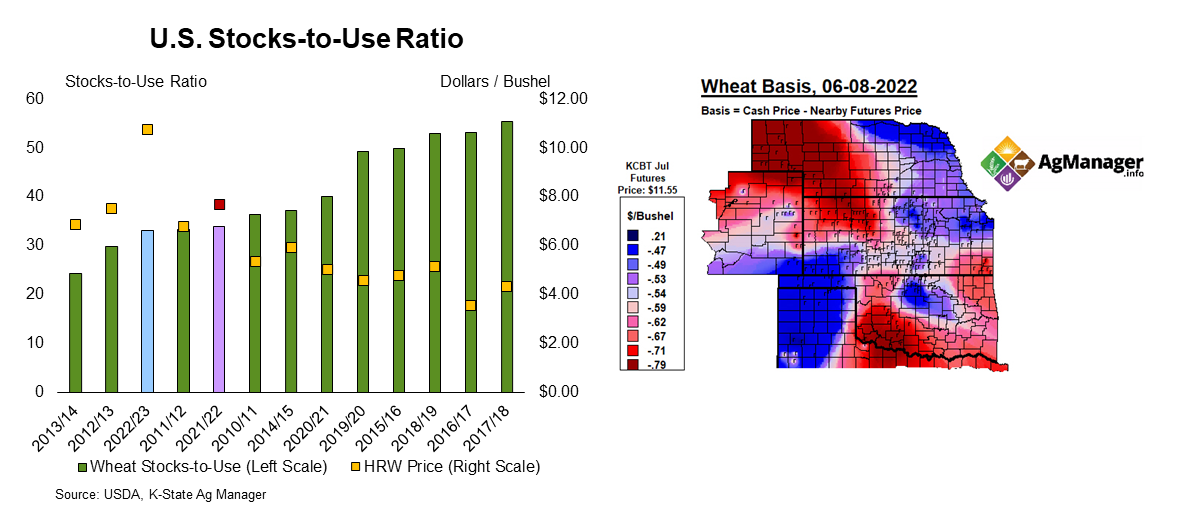
Wheat prices continue to challenge recent highs as a global shortage of wheat, punctuated by the Ukraine-Russia conflict and early drought, combined with relatively strong demand continue to fuel the market. For instance, cash prices in 2022 for hard red winter wheat in western Kansas have remained above the top 10th percentile of prices since 2000. Additionally, cash prices since March have been in the top 2 percentile.
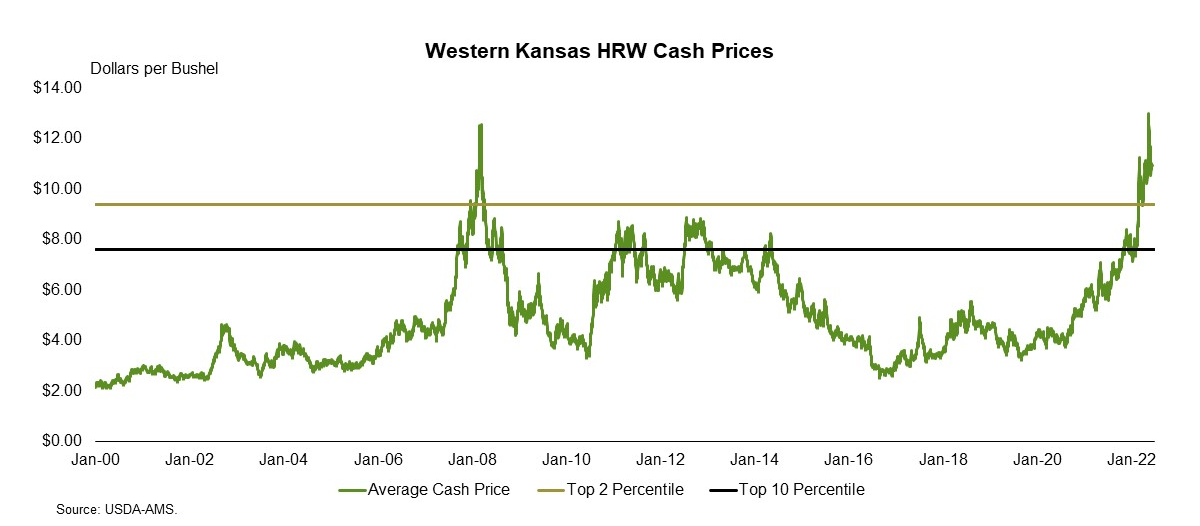
How long the market can hold at these levels will be an important consideration in pricing the 2022 and 2023 crops. Historically, the market has struggled to hold wheat prices above $8 per bushel for a prolonged period. In fact, the current streak of consecutive days with cash prices above $8 per bushel is the third longest streak since 2000. On average, the cycles of consecutive days above $8 per bushel from 2007 through 2021 lasted about 25 trading days, and prices can be moderately lower 12 and 18 calendar months from the start of the cycle.
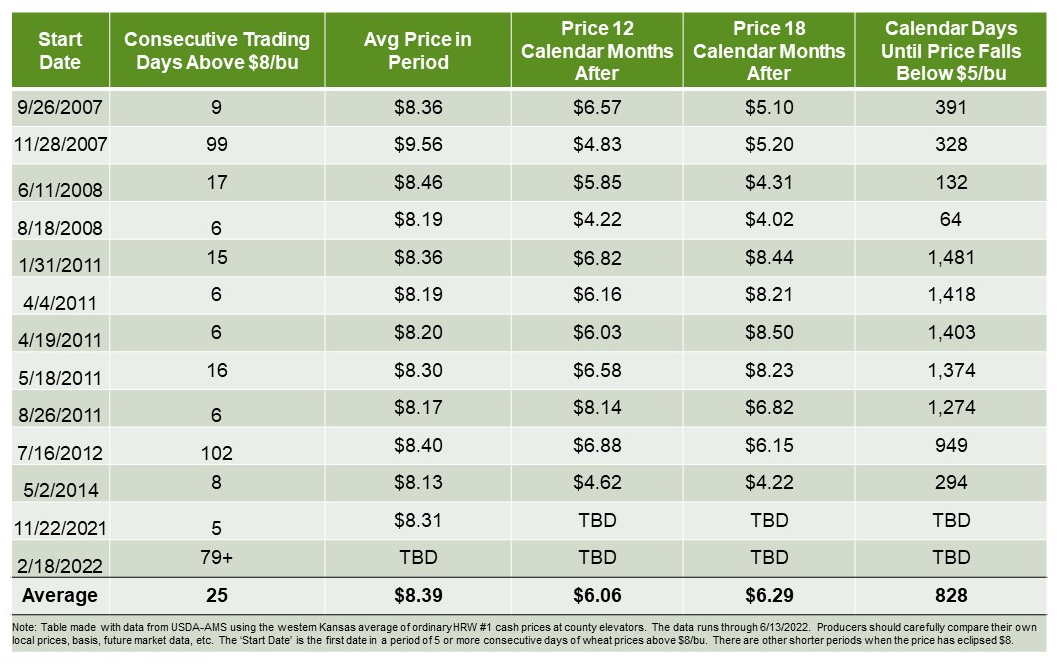
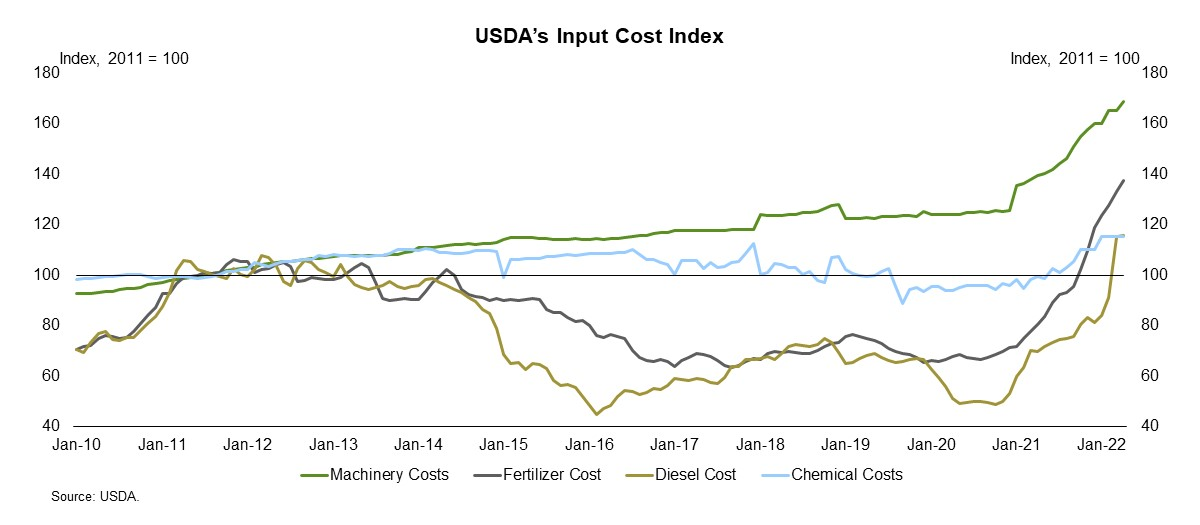
The table above would suggest that farmers will need to carefully, and in many ways proactively, balance options to protect prices alongside rising production costs and potential yield risks. In particular, the appreciation in input costs poses a significant risk should the price of wheat decline. The USDA’s estimate of chemical, fertilizer and diesel prices have significantly increased to record heights. Moreover, these prices can be slower to decline, further punctuating the need for careful and proactive price and risk management.
Drought, Flooded Yields, or Both?
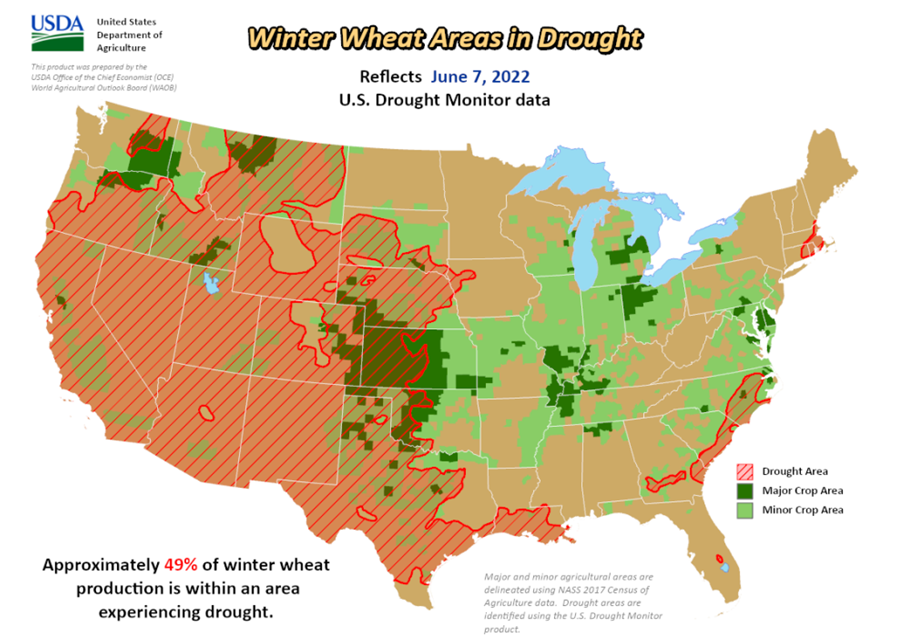
It is no secret that much of the Western United States is in a drought. The USDA currently estimates that about 49 percent of winter wheat production lies in a drought area as of early June. However, a much higher percent of the crop was in drought during key growing periods in May. For example, in mid-May the USDA estimated that 66 percent of the winter wheat crop was in a drought area. The late rush of rain likely helped preserve some yield loss, but many producers are generally expecting subdued yields in 2022.
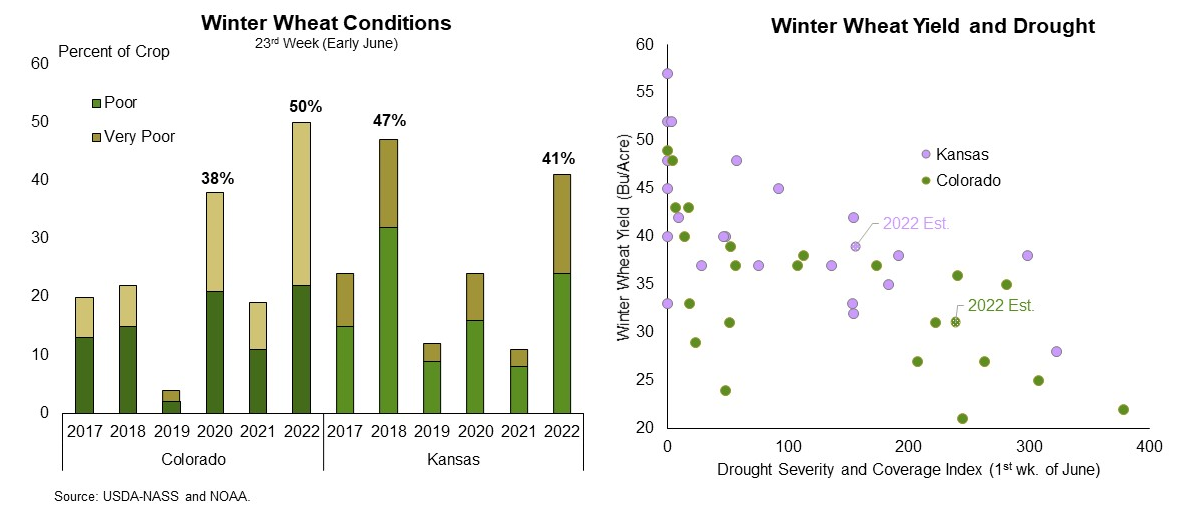
Crop condition reports in Kansas and Colorado also indicate concern for potential yields. As of early June, the USDA’s crop condition report indicated that 50 percent of wheat in Colorado was rated poor to very poor, the fourth highest amount since 1991. Winter wheat yields in Colorado have averaged 28 bushels per acre when more than 40 percent of the crop is rated poor to very poor in early June, slightly lower than the current USDA forecast of 31 bushels per acre. Likewise, the historical relationship of yield to the USDA’s Drought Severity and Coverage Index indicates that yields could be pressured lower. Some regions of eastern Colorado received moisture in late-May which may help somewhat soften the impact to yields.
In Kansas, nearly 41 percent of the crop was rated poor to very poor in early June, the ninth highest since 1991. On average, winter wheat yields in Kansas average about 34 bushels per acre when more than 40 percent of the crop is rated poor to very poor in early June, also slightly lower than the current USDA forecast of 39 bushels per acre. The historical relationship of yield to the USDA’s Drought Severity and Coverage Index also indicates some potential downward pressure on Kansas wheat yields. However, like Colorado, much of Kansas received excellent moisture at the end of May which should help support final yields for many producers.
Can Wheat Punch the Export Ticket?
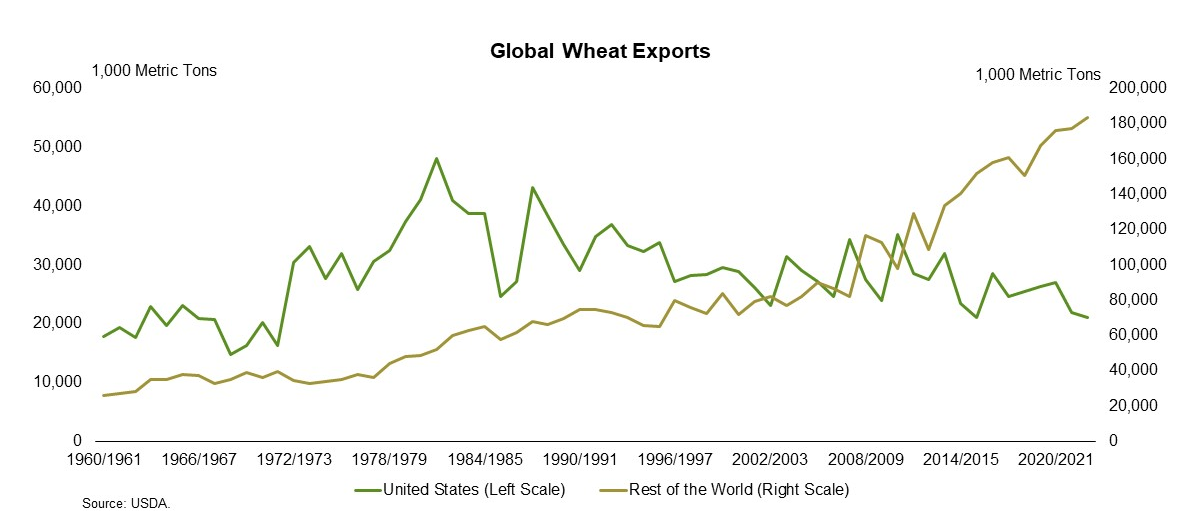
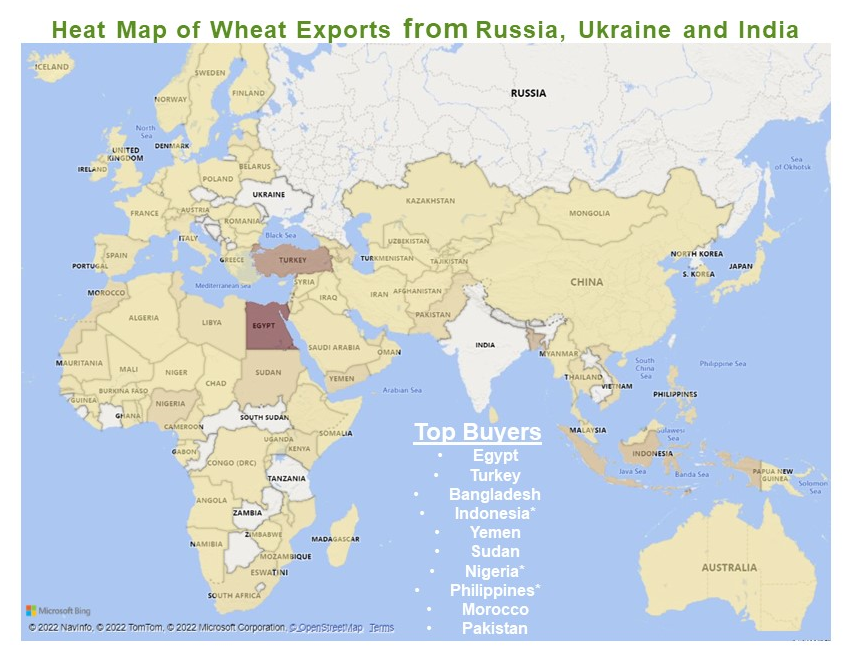
The expectation of stronger wheat exports in 2022 became a quick and trendy headline after the fallout from the Ukraine-Russia conflict and, more recently, some potential limitations in exports from India. However, the most recent USDA World Ag Supply and Demand Estimates (WASDE) expects wheat exports from the U.S. to decline about 4 percent from the previous year to the lowest level since the 1971/1972 marketing year. Conversely, the total wheat exported from all other countries is expected to increase about 3 percent to a record high.
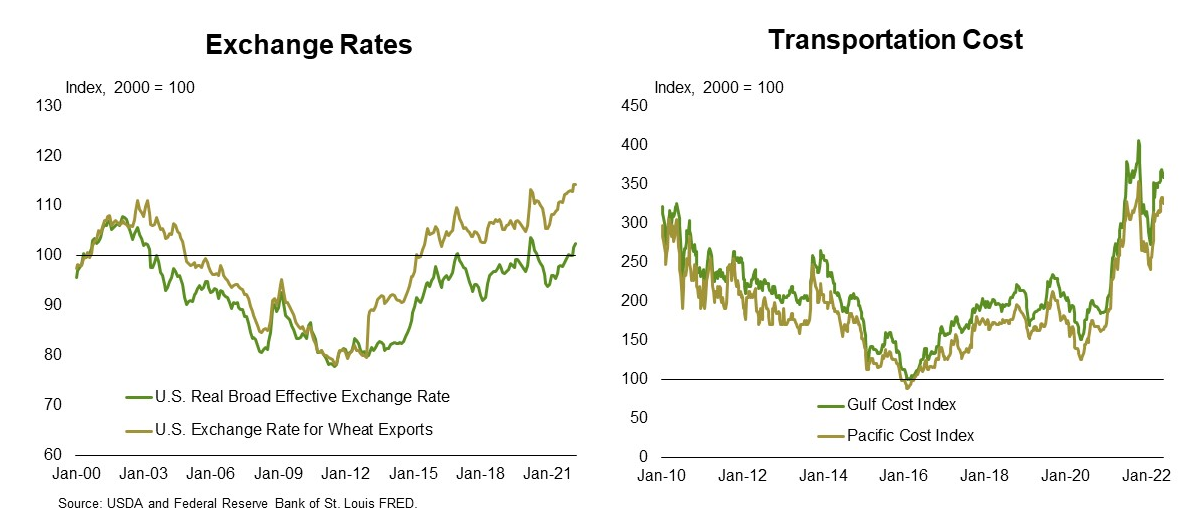
Part of the reason for lower U.S. exports is the relatively tight stock situation for the U.S. The current USDA forecasts have ending stocks declining about 4 percent from the previous year to the lowest level since the 2013/2014 marketing season. Additionally, high wheat prices combined with strengthening exchange rates and very high transportation costs have likely priced the U.S. out of some potential export markets. As an example of wheat costs impacting exports, the quantity of wheat exported in the first four months of 2022 is the second lowest since 2010, however, the value of wheat exported in the first four months of 2022 is the third highest since 2010.
Moreover, the top destinations for wheat from Ukraine, Russia and India are somewhat different markets than the U.S. currently serves. In fact, the U.S. shares only three of the top 10 destinations (Indonesia, Nigeria and the Philippines), based on total dollars over the last 5 years, for wheat and flour exports from Ukraine, Russia and India combined.
While the U.S. does export some wheat and flour to countries served primarily by Russia, Ukraine and India, it also has other trade partners that likely also have standing demand for U.S. wheat.
Taking these points together, along with many other global wheat trade factors, it seems unlikely that U.S. wheat exports will significantly increase in the new marketing year. To be clear, U.S. producers are still benefiting from the global shock to wheat production and the need for new export partners, as the global price of wheat has increased, but the USDA’s estimate of lower wheat exports seems probable.
Stocks-to-Use Ratios
Baking these dynamics together creates a very favorable stocks-to-use ratio for wheat farmers. The USDA currently forecasts that the stocks-to-use ratio for the 2022-2023 marketing year will be the third lowest in the last 13 years.
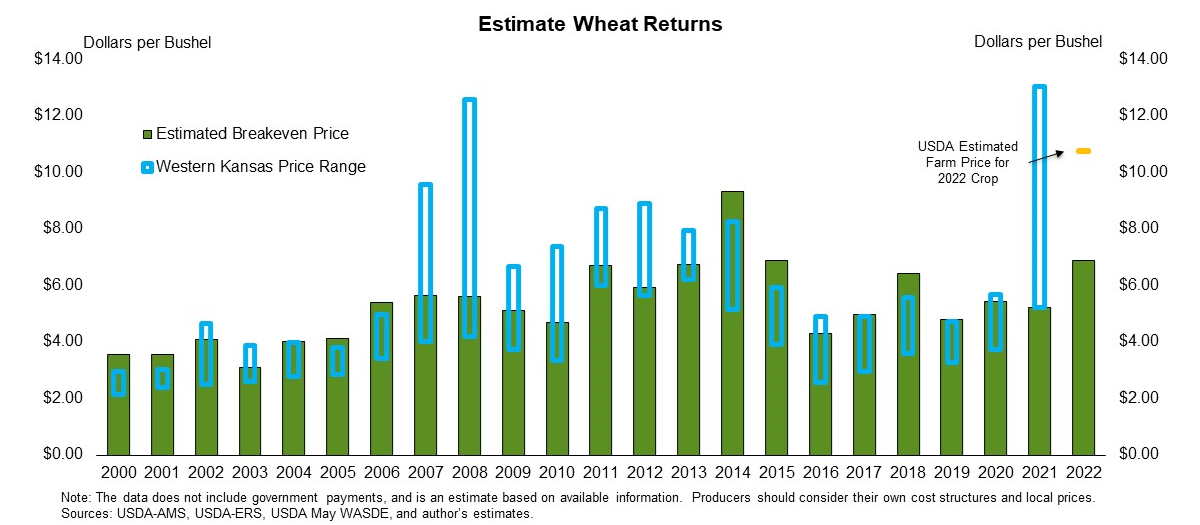
Additionally, the season average farm price of $10.75 per bushel is the highest that the USDA has forecast. Local basis will be challenged by the previously mentioned transportation costs. However, prices overall are expected to be very strong for the producer and should help combat higher input prices. The tight stocks-to-use ratio in the current crop is also expected to carry over to some extent in the following market year, perhaps helping future prices avoid a modest correction.
Given the strong support for wheat prices, it is likely that many producers will overcome weaker yields and elevated input prices. Although weaker yields and high input prices have raised the breakeven price well above that of recent years, the extremely strong price for wheat should allow for healthy profit margins. For example, profit margins in Kansas appear healthy when using the USDA’s estimated average wheat price of $10.75 per bushel.
Key Insights
Wheat prices continue to challenge recent highs amid a global shortage, exacerbated by the Ukraine-Russia conflict and drought in the western United States. How long the market can hold at these levels will be an important consideration in pricing the 2022 and 2023 crops. Input costs have also significantly increased, heightening the need for careful price and risk management.
Ending stocks are down about 6 percent to the lowest level since the 2013-2014 marketing season. Additionally, high wheat prices combined with strengthening exchange rates and very high transportation costs have likely priced the U.S. out of some potential export markets. The shortage in global wheat has helped support strong prices for farmers, but it is unlikely that the U.S. will physically export more wheat in the new marketing year. Profitability for many Kansas wheat farmers looks strong for the current crop.
LEARN MORE
We are proud to be a trusted financial partner to the agriculture industry, with personalized solutions and expertise to help your business grow. To learn more, please visit our contact page or call us today at 800.800.4865.
Disclaimer: This material is for informational purposes only and cannot be relied on to replace your own judgment or that of the professionals you work with in assessing the accuracy or relevance of the information to your own operations. Nothing in this material shall constitute a commitment by American AgCredit to lend money or extend credit. This information is provided independent of any lending, other financing or insurance transaction. This material is a compilation of outside sources and the various authors’ opinions. Assumptions have been made for modeling purposes. American AgCredit does not represent that any such assumptions will reflect future events.