
Presented by:
![]()
2022 Grape Crush: Don’t Bet Too Heavily on a Repeat Performance
The crush was below average for a third consecutive year and the smallest since 2011
According to the National Agricultural Statistical Service’s preliminary California Grape Crush Report, the 2022 crush came in at 3.35 million tons, down 8% from 2021 and 13% below the ten-year average. It was the smallest crush since 2011. Red tonnage was off by 12% versus the average, while white tonnage was short by 14%.
Following a seven-year period of relatively stable and generously sized harvests, fires, drought and other severe weather events have taken a toll on the California grape crop over the past three years. The 2022 crush was the smallest in the past 10 years, while the 2020 and 2021 crushes were the second and third lightest, respectively. The crush has averaged just under 3.5 million tons over the last three years – which compares to an average of more than four million for the prior three – a deficit of 15%.
The three successive short harvests have pulled the California grape market into a more balanced position, which has in turn stimulated appreciation in grape prices.
All down, but variability across regions
Output was well below average in both the coastal and interior regions of the state in 2022 though the North Coast fared better than the Central Coast and the Northern Interior was closer to the average than the Southern Interior, where some vineyards have been pulled in recent years.
Figure 1 depicts the size of the crush in each district indexed to its ten-year average, which is assigned a value of 100. Values greater than 100 indicate a larger than average crush, while those fewer than 100 signify a smaller than average crush in that year.
Some highlights of note:
- The coastal regions have been hit harder than the interior in recent years. North Coast producers crushed 21% fewer tons over the past three years relative to the prior three (Napa’s crush was down by 29%), while the Central Coast experienced a 16% shortfall.
- The Southern Interior’s three-year output deficit was 13%, but some of the shortfall here is due to vineyard removals rather than lower yields.
- The Northern Interior has fared better with a deficit of just 4% relative to the 2017 to 2019 period.
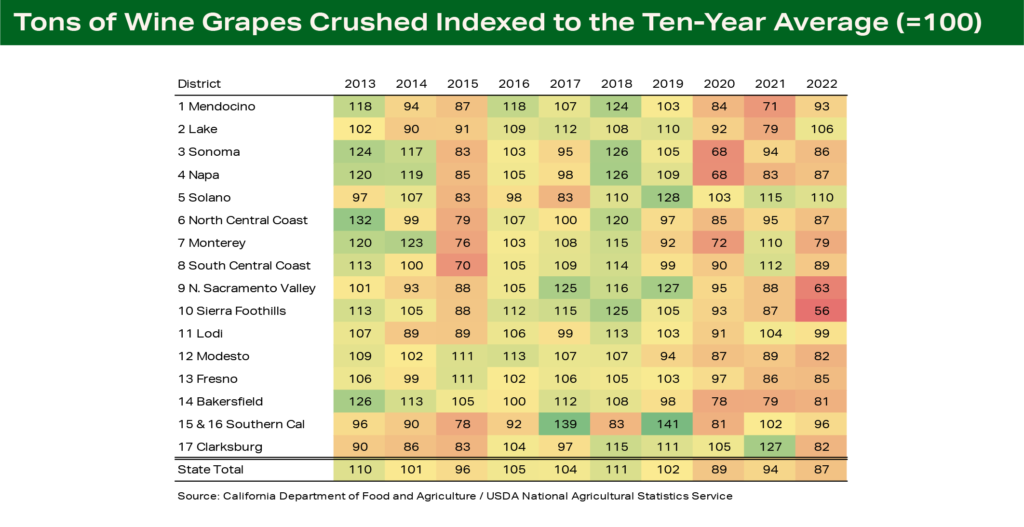 Figure 1
Prices were up in nearly all districts in 2022 – but the market remains bifurcated
The average price paid for a ton of California wine grapes rose by 5% in 2022 to $944. Red grape prices jumped 7%, while white varietal prices rose just 1%. The smaller increase for whites, though, was partly attributable to a redistribution of sales from the coast to the interior.
Pricing was up across the state in 2022. The average price per ton rose in 15 of 17 districts. Prices increased by 5% or more in six of the eight coastal districts, led by a 12% gain in Napa. All five of the interior districts recorded higher prices and appreciation improved progressively moving north to south.
Year-over-year fluctuations in average grape prices can be influenced by shifts in the mix of grapes sold and tend to be a lagging indicator of changes in the market because many sales reflect prices paid based on contracts signed in prior years. Thus, annual changes are best viewed as a directional indicator.
Viewing prices in a longer-term context provides additional insight into the state of the grape market. In Figure 2, the average price in each district is indexed to its level from ten years ago, which is scaled to 100. The chart indicates that the trajectory of prices has varied markedly between the coast and interior, and the higher-priced districts in each region have generally had more appreciation than the least expensive districts.
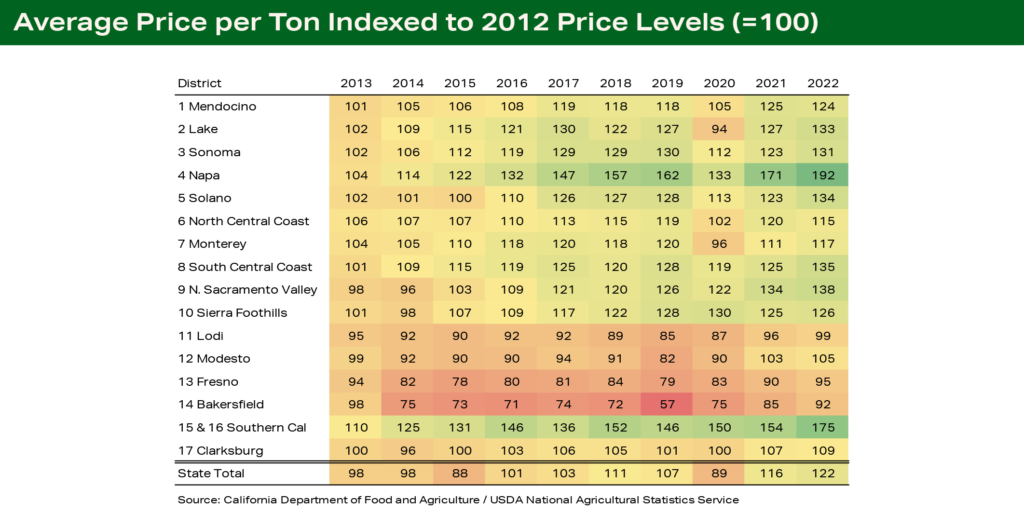 Figure 2
Grape prices in the interior declined steadily between 2012 and 2019 as shrinking demand for value priced wine, which is primarily sourced from interior grapes, led to oversupply. Prices have rebounded in recent years as supply has been pared back, but there has been little or no appreciation over the past decade. Average prices in the two largest interior districts (11 and 13), which account for more than half of California’s grape output, remain below their level in 2012.
Conversely, the coastal regions have recorded solid appreciation over the past ten years, interrupted only by the pandemic and smoke-impacted 2020 vintage. This mirrors growing demand for premium wines, which are typically sourced from the coastal districts.
Growth in wine sales has been progressively stronger at successively higher price points, and grape price appreciation in Napa, the state’s premier wine appellation, has outpaced that of the other coastal regions by a wide margin.
Continue reading full grape crush report.
Disclaimer: This material is for informational purposes only and cannot be relied on to replace your own judgment or that of the professionals you work with in assessing the accuracy or relevance of the information to your own operations. Nothing in this material shall constitute a commitment by American AgCredit to lend money or extend credit. This information is provided independent of any lending, other financing or insurance transaction. This material is a compilation of outside sources and the various authors’ opinions. Assumptions have been made for modeling purposes. American AgCredit does not represent that any such assumptions will reflect future events.